Types of Data Analytics Explained: Descriptive, Diagnostic, Predictive & Prescriptive
Introduction
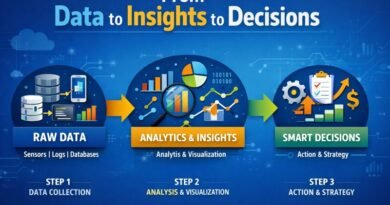
Data analytics is the process of collecting, cleaning, analyzing, and interpreting data to extract meaningful insights that support decision-making. In today’s data-driven world, organizations across industries rely on data analytics to understand performance, identify problems, and plan future strategies. However, data analytics is not a single technique. It is divided into different types, each designed to answer a specific kind of question.
Understanding the different types of data analytics is important because each type serves a unique purpose in the decision-making process. Some types focus on analyzing past data, while others help explain causes, predict future outcomes, or recommend actions. Without knowing which type of analytics to use, organizations may draw incomplete or incorrect conclusions from their data.
Each type of data analytics answers a different business question. Descriptive analytics explains what happened, diagnostic analytics explains why it happened, predictive analytics forecasts what may happen next, and prescriptive analytics suggests what actions should be taken. Together, these types form a complete framework for data-driven decision-making.
What Are the Types of Data Analytics?
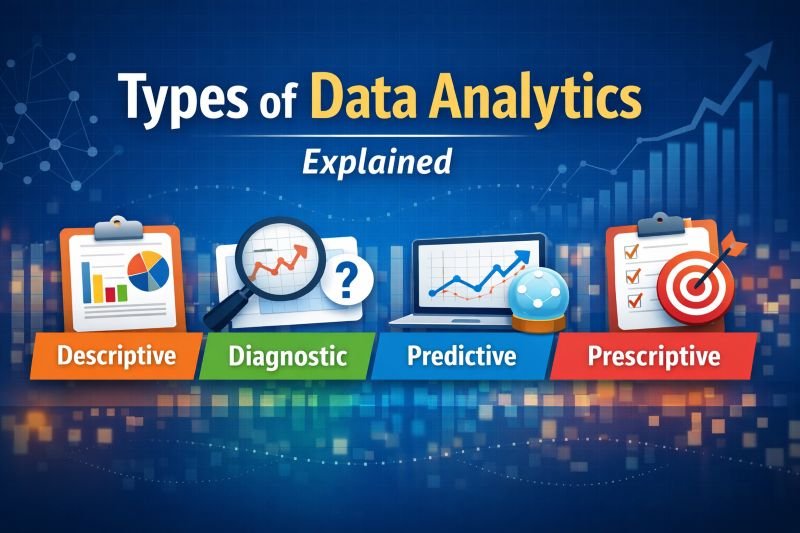
Data analytics is commonly classified into four main types based on the type of insight they provide and the questions they answer. These four types work together to help organizations move from understanding past events to making informed future decisions.
The four types of data analytics are descriptive analytics, diagnostic analytics, predictive analytics, and prescriptive analytics.
Each type builds on the previous one and adds more value to the decision-making process.
- Descriptive analytics focuses on summarizing historical data to understand what has already happened.
- Diagnostic analytics examines data to identify the reasons behind past outcomes.
- Predictive analytics uses historical data and patterns to forecast future events or trends.
- Prescriptive analytics goes a step further by recommending actions that can lead to the best possible outcomes.
Together, these four types provide a structured and comprehensive approach to analyzing data and solving real-world business problems.
What is Descriptive Analytics?
Descriptive analytics is the most basic and widely used type of data analytics. It focuses on analyzing historical data to understand what has already happened. In simple words, descriptive analytics summarizes past data and presents it in an easy-to-understand format, such as reports, charts, or dashboards. It does not try to predict the future or explain causes; instead, it provides a clear picture of past performance.
The main purpose of descriptive analytics is to turn raw data into meaningful information that helps organizations track trends, monitor performance, and measure key metrics. It answers questions like how much was sold last month, how many users visited a website, or how students performed in an exam.
Key Techniques Used in Descriptive Analytics
Descriptive analytics relies on several common techniques to summarize and organize data effectively. Aggregation is used to combine data from multiple records, such as calculating total sales or average scores. Data summarization helps condense large datasets into simple statistics like totals, percentages, and averages. Reporting and dashboards present this summarized data visually using tables, charts, and graphs, making it easier for stakeholders to understand performance at a glance.
Real-Life Examples of Descriptive Analytics
Descriptive analytics is widely used across different domains. Monthly sales reports help businesses understand revenue trends and performance over time. Website traffic analysis shows metrics such as page views, sessions, and user engagement. Student performance reports summarize exam scores, attendance, and overall academic progress.
Common Tools Used
Popular tools for descriptive analytics include Excel for basic analysis and reporting, SQL for extracting and summarizing data from databases, and Power BI or Tableau for creating interactive dashboards and visual reports.
What is Diagnostic Analytics?
Diagnostic analytics focuses on identifying why a particular event or outcome occurred. While descriptive analytics explains what happened, diagnostic analytics goes a step further by analyzing data to find the root cause behind past results. In simple terms, it helps organizations understand the reasons behind successes or failures by examining relationships and patterns within the data.
The importance of diagnostic analytics lies in root-cause analysis. Without understanding why something happened, it is difficult to fix problems or replicate successful outcomes. Diagnostic analytics enables organizations to move beyond surface-level reporting and uncover hidden factors that influence performance, such as customer behavior, system issues, or operational inefficiencies.
Key Techniques Used in Diagnostic Analytics
Several techniques are commonly used in diagnostic analytics to explore data in depth. Drill-down analysis allows analysts to break down summarized data into detailed views, such as analyzing sales by region, product, or time period. Correlation analysis helps identify relationships between variables, for example, understanding how price changes affect sales volume. Data mining techniques are used to discover patterns, anomalies, and trends within large datasets.
Real-Life Examples of Diagnostic Analytics
In business, diagnostic analytics is used to analyze a drop in sales by examining factors such as pricing, customer behavior, or seasonal trends. In manufacturing, it helps investigate machine failures by analyzing sensor data and maintenance logs. In marketing, diagnostic analytics evaluates campaign performance to understand why a campaign succeeded or failed.
Common Tools Used
Common tools used in diagnostic analytics include SQL for querying and exploring data, Python for advanced analysis and pattern detection, and business intelligence (BI) tools for interactive analysis and reporting.
What is Predictive Analytics?
Predictive analytics focuses on estimating what is likely to happen in the future based on historical data and existing patterns. Unlike descriptive and diagnostic analytics, which analyze past events, predictive analytics uses data-driven models to forecast future outcomes. In simple terms, it helps organizations anticipate trends, risks, and opportunities before they occur.
Predictive analytics relies heavily on historical data, patterns, and trends to make accurate predictions. By analyzing past behavior and performance, organizations can identify repeating patterns and use them to estimate future results. The more accurate and relevant the historical data, the better the predictions.
Techniques and Models Used in Predictive Analytics
Several analytical techniques and models are used in predictive analytics. Regression analysis helps understand the relationship between variables and predict numerical outcomes such as sales or demand. Time-series forecasting analyzes data collected over time to predict future values, making it useful for seasonal trends and long-term planning. Machine learning models automatically learn patterns from data and improve predictions over time, especially when dealing with large and complex datasets.
Real-Life Examples of Predictive Analytics
Predictive analytics is widely used for demand forecasting, helping businesses plan inventory and production. It is also used in customer churn prediction to identify customers who are likely to stop using a service. In IoT-based systems, predictive analytics supports predictive maintenance by forecasting equipment failures before they occur.
Common Tools Used
Common tools for predictive analytics include Python and R for model development and analysis, along with machine learning platforms that support large-scale predictive modeling and automation.
Comparison Table: Types of Data Analytics
The following table provides a clear comparison of the four main types of data analytics. It highlights the key question each type answers, its primary purpose, and a simple real-life example. This comparison helps in understanding how each type of analytics fits into the overall decision-making process.
| Type of Data Analytics | Key Question Answered | Primary Purpose | Real-Life Example |
|---|---|---|---|
| Descriptive Analytics | What happened? | Summarize and report historical data | Monthly sales report |
| Diagnostic Analytics | Why did it happen? | Identify root causes and reasons | Analysis of a sales drop |
| Predictive Analytics | What will happen? | Forecast future trends and outcomes | Demand forecasting |
| Prescriptive Analytics | What should be done? | Recommend actions and solutions | Inventory planning |
Each type of data analytics builds upon the previous one. Descriptive analytics provides a summary of past events, diagnostic analytics explains the reasons behind those events, predictive analytics estimates future outcomes, and prescriptive analytics suggests the best actions to take. Together, these types create a complete and effective data analytics framework for informed decision-making.
Types of Data Analytics in Real-World Industries
Data analytics is widely used across industries to improve efficiency, reduce risks, and support better decision-making. Different types of data analytics are applied based on industry needs and the nature of the problems being solved.
- In business and marketing, descriptive analytics is used to track sales performance, customer engagement, and campaign results. Diagnostic analytics helps identify reasons for changes in customer behavior or campaign performance. Predictive analytics is used for demand forecasting and customer churn prediction, while prescriptive analytics supports pricing strategies and marketing optimization.
- In healthcare, descriptive analytics summarizes patient records and treatment outcomes. Diagnostic analytics helps identify causes of diseases or treatment failures. Predictive analytics is used for disease risk prediction and patient readmission forecasting, while prescriptive analytics assists in treatment planning and resource allocation.
- In manufacturing and IoT, descriptive analytics monitors machine performance and production metrics. Diagnostic analytics investigates equipment failures and quality issues. Predictive analytics enables predictive maintenance by forecasting machine breakdowns, and prescriptive analytics recommends optimal maintenance schedules and process improvements.
- In finance and banking, descriptive analytics tracks transactions and financial performance. Diagnostic analytics identifies causes of losses or fraud. Predictive analytics assesses credit risk and market trends, while prescriptive analytics supports investment and risk management decisions.
Career Relevance of Each Type of Data Analytics
Different roles use different types of data analytics depending on experience and responsibility. Entry-level roles such as data analysts and business analysts primarily work with descriptive and diagnostic analytics, focusing on reporting, dashboards, and root-cause analysis. Advanced roles such as data scientists, analytics engineers, and senior analysts use predictive and prescriptive analytics to build models, forecast outcomes, and recommend strategic actions. Understanding all types of analytics helps professionals grow from basic reporting roles to advanced, decision-driven positions.
Frequently Asked Questions (FAQs)
What is the most commonly used type of data analytics?
Descriptive analytics is the most commonly used type of data analytics. It is widely applied across industries to summarize historical data, generate reports, and track performance metrics such as sales, revenue, website traffic, and operational efficiency.
Is predictive analytics difficult to learn?
Predictive analytics can be challenging for beginners because it involves statistical concepts and machine learning techniques. However, with a strong foundation in descriptive and diagnostic analytics, learning predictive analytics becomes easier over time through practice and hands-on projects.
Can beginners start with descriptive analytics?
Yes, descriptive analytics is the best starting point for beginners. It requires minimal coding and focuses on understanding data through reports and visualizations, making it ideal for building a strong analytics foundation.
Conclusion
In conclusion Data analytics can be broadly divided into four types: descriptive, diagnostic, predictive, and prescriptive analytics. Descriptive analytics explains what happened, diagnostic analytics identifies why it happened, predictive analytics forecasts what is likely to happen, and prescriptive analytics recommends actions to achieve the best outcomes. Together, these types provide a complete framework for data-driven decision-making.
For beginners, the recommended learning path is to start with descriptive analytics, move to diagnostic analytics, and then gradually explore predictive and prescriptive analytics as skills improve. To continue learning, readers can explore related articles such as What is Data Analytics? Definition, Types & Real-Life Examples and Common Data Analytics Tools & Technologies to strengthen their understanding and practical knowledge.