What is Data Analytics? Definition, Types & Real-Life Examples
In today’s digital world, data is generated everywhere — from mobile apps and websites to IoT sensors, machines, and business systems. However, raw data alone has no value unless it is properly analyzed. This is where data analytics plays a crucial role.
Data analytics helps organizations, governments, and individuals make better decisions by understanding patterns, trends, and insights hidden inside data. From predicting customer behavior to improving healthcare and smart manufacturing, data analytics is shaping the future.
In this article, we will clearly explain what data analytics is, its types, real-life examples, tools, skills, and career opportunities — all in simple words.
What is Data Analytics?
Data analytics is the process of collecting, cleaning, analyzing, and interpreting data to discover useful information and support effective decision-making. In today’s digital environment, organizations generate large volumes of data from websites, mobile applications, business systems, and connected devices. Data analytics helps convert this raw and unstructured data into meaningful insights that can be used to improve performance and solve problems.
In simple words, data analytics means studying data to understand what happened, why it happened, and what is likely to happen next. It focuses on finding patterns, trends, and relationships within data so that decisions are based on facts rather than assumptions. By analyzing data, businesses and organizations can reduce uncertainty and make more informed choices.
From a formal perspective, data analytics is a systematic approach that uses statistical methods, analytical techniques, and specialized tools to examine raw data and transform it into actionable insights. These insights help organizations optimize operations, identify opportunities, and minimize risks.
For example, consider an online shopping website that experiences a sudden drop in sales. By analyzing customer data such as page views, cart abandonment rates, purchase history, and user behavior, the company can identify the root cause of the problem. Based on these insights, it can improve website design, adjust pricing strategies, or enhance marketing campaigns to increase sales.
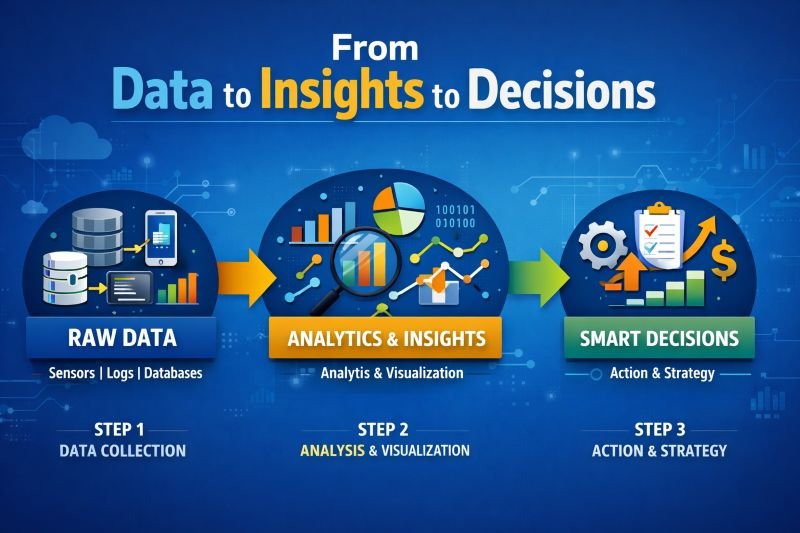
How Does Data Analytics Work? (Step-by-Step Process)
Data analytics works through a structured and systematic process that converts raw data into meaningful insights. This process is often called the data analytics lifecycle, and each step plays a crucial role in ensuring accurate and reliable results.
Data Collection
The first step in data analytics is collecting data from various sources. Data can come from databases, IoT sensors, websites and mobile applications, surveys, transaction logs, and system-generated records. In IoT-based systems, sensors continuously generate real-time data related to temperature, pressure, location, or usage patterns. The quality of analysis largely depends on how accurately and consistently this data is collected.
Data Cleaning
Raw data is rarely perfect. It often contains missing values, duplicate records, incorrect formats, or errors. Data cleaning involves removing inconsistencies, correcting mistakes, and handling missing data to ensure reliability. Clean data is essential because inaccurate data can lead to misleading insights and poor decisions.
Data Processing
Once the data is cleaned, it is processed and transformed into a structured format suitable for analysis. This step may include sorting, filtering, aggregating, or normalizing data using tools such as Excel, SQL, or Python. Proper processing helps analysts work efficiently with large datasets.
Data Analysis
In this stage, analysts apply statistical techniques, queries, and analytical models to identify patterns, trends, and relationships within the data. This is where meaningful insights begin to emerge.
Data Visualization
Insights are then presented using charts, graphs, dashboards, and reports. Visualization makes complex data easy to understand for non-technical users and stakeholders.
Decision Making
Finally, organizations use these insights to make data-driven decisions, improve performance, reduce risks, and plan future strategies.
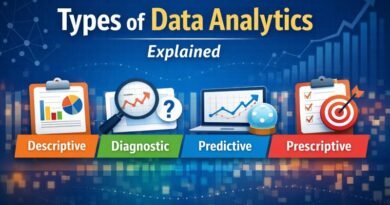
Types of Data Analytics
There are four main types of data analytics, each answering a different business question.
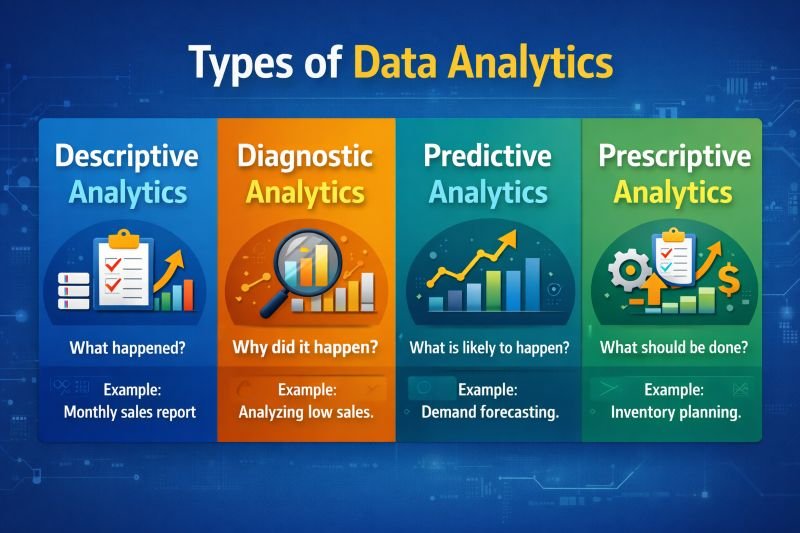
Descriptive Analytics
Question answered: What happened?
Descriptive analytics focuses on summarizing historical data.
Examples:
-
Monthly sales reports
-
Website traffic reports
-
Student exam result analysis
Tools Used: Excel, SQL, dashboards
Diagnostic Analytics
Question answered: Why did it happen?
This type analyzes data to find the root cause of a problem.
Examples:
-
Why did sales drop last month?
-
Why did machine failure occur?
Techniques Used: Data drill-down, correlation analysis
Predictive Analytics
Question answered: What is likely to happen next?
Predictive analytics uses historical data and machine learning to forecast future outcomes.
Examples:
-
Demand forecasting
-
Customer churn prediction
-
Weather prediction
Prescriptive Analytics
Question answered: What should be done?
Prescriptive analytics suggests actions to achieve the best outcome.
Examples:
-
Best pricing strategy
-
Inventory optimization
-
Route optimization for delivery
Real-Life Examples of Data Analytics
Data Analytics in Business
-
Customer behavior analysis
-
Sales forecasting
-
Inventory management
Data Analytics in Healthcare
-
Disease prediction
-
Patient treatment optimization
-
Hospital resource planning
Data Analytics in Manufacturing & IoT
-
Predictive maintenance
-
Sensor data monitoring
-
Quality control
Data Analytics in Marketing
-
Campaign performance analysis
-
Customer segmentation
-
Conversion rate optimization
Data Analytics in Finance
-
Fraud detection
-
Credit risk assessment
-
Stock market analysis
Common Data Analytics Tools & Technologies
Data analytics relies on a wide range of tools and technologies to collect, process, analyze, and visualize data effectively. The choice of tools depends on the type of data, the complexity of analysis, and business requirements. Some of the most commonly used data analytics tools are widely adopted across industries due to their reliability and ease of use.
- Excel is one of the most popular tools for data cleaning, sorting, filtering, and basic analysis. It is widely used by beginners for quick calculations and reports.
- SQL is essential for extracting and managing data stored in databases. It allows analysts to query large datasets efficiently.
- Python is used for advanced data analysis, automation, and handling large volumes of data through libraries such as Pandas and NumPy.
- R is mainly used for statistical analysis and academic or research-based data projects.
- Power BI and Tableau are powerful data visualization tools that help create interactive dashboards and reports for better data understanding.
- Google Analytics is commonly used to analyze website traffic and user behavior.
- Cloud platforms such as AWS, Azure, and Google Cloud enable scalable storage, real-time analytics, and processing of large datasets.
Skills Required for Data Analytics
Technical Skills
-
Data cleaning and preprocessing
-
SQL and databases
-
Data visualization
-
Basic statistics
-
Python or R (optional but useful)
Non-Technical Skills
-
Analytical thinking
-
Problem-solving
-
Communication skills
-
Business understanding
Data Analytics vs Data Science vs Business Analytics
| Aspect | Data Analytics | Data Science | Business Analytics |
|---|---|---|---|
| Primary Focus | Analyzing existing data to find patterns and insights | Building advanced models using AI, machine learning, and statistics | Using data insights to support business decisions |
| Main Objective | Understand what happened and why | Predict future outcomes and automate decision-making | Improve business performance and strategy |
| Type of Data Used | Structured and semi-structured data | Structured, semi-structured, and unstructured data | Mostly structured business data |
| Level of Coding | Basic to intermediate | Advanced | Minimal |
| Common Tools | Excel, SQL, Power BI, Tableau | Python, R, TensorFlow, PyTorch | Excel, Power BI, business intelligence tools |
| Statistical Knowledge | Basic statistics | Advanced statistics and mathematics | Basic statistics |
| Use of AI & ML | Limited | Extensive | Very limited |
| Output | Reports, dashboards, and insights | Predictive models and intelligent systems | Business strategies and action plans |
| Typical Job Roles | Data Analyst, BI Analyst | Data Scientist, ML Engineer | Business Analyst, Strategy Analyst |
| Industry Applications | Operations, reporting, performance tracking | AI systems, recommendation engines, forecasting | Sales, marketing, finance, management decisions |
Career Opportunities in Data Analytics
Popular job roles include:
-
Data Analyst
-
Business Analyst
-
BI Analyst
-
Junior Data Scientist
Salary Overview (Approx.)
-
Freshers: ₹4–7 LPA
-
Experienced: ₹10–20+ LPA
Advantages of Data Analytics
-
Better decision-making
-
Cost optimization
-
Improved efficiency
-
Risk reduction
-
Enhanced customer experience
Challenges & Limitations of Data Analytics
-
Poor data quality
-
Data privacy concerns
-
Skill gap
-
Tool complexity
Future Scope of Data Analytics
The future scope of data analytics is very strong and continues to expand with the rapid growth of artificial intelligence, Internet of Things, and cloud computing technologies. As organizations generate massive volumes of data from digital platforms, connected devices, and business systems, the need to analyze this data efficiently is becoming more critical than ever. Data analytics is evolving from traditional, historical analysis to real-time and predictive analytics, enabling faster and more accurate decision-making.
Industries such as healthcare, manufacturing, finance, retail, and smart cities are increasingly using advanced analytics to improve efficiency, reduce costs, and enhance customer experiences. The integration of AI and machine learning is allowing organizations to automate data analysis, identify complex patterns, and generate actionable insights with minimal human intervention. At the same time, cloud-based analytics platforms are making data analytics more scalable, accessible, and cost-effective for businesses of all sizes.
As data-driven decision-making becomes a standard practice across industries, the demand for skilled data analytics professionals is expected to grow steadily. This makes data analytics a future-proof field with long-term career opportunities and continuous innovation.
Frequently Asked Questions (FAQs)
Here are some FAQs related to data analytics are as follows:
What is data analytics in simple words?
Data analytics means analyzing data to find useful information and patterns.
Is data analytics a good career?
Yes, data analytics offers high demand, good salary, and long-term growth.
Do I need coding for data analytics?
Basic SQL is required. Python is helpful but not mandatory for beginners.
What is the difference between big data and data analytics?
Big data focuses on large datasets, while data analytics focuses on analyzing data for insights.
Can freshers learn data analytics?
Yes, freshers can start with Excel, SQL, and basic analytics concepts.
Conclusion
In conclusion, Data analytics has become an essential tool for transforming raw and unstructured data into meaningful insights that support informed decision-making. Its applications extend across multiple industries, including business, healthcare, finance, manufacturing, and emerging smart technologies. By analyzing data effectively, organizations can improve efficiency, reduce risks, and gain a competitive advantage. For students and professionals, learning data analytics builds valuable skills that are in high demand in today’s data-driven world. Overall, data analytics empowers individuals and organizations to make smarter decisions and unlock new opportunities for growth and innovation.